Finding Outliers And Bad Data In Stock Data
Finding outliers and bad data in stock data#
Problem#
I get stock data from an API service. Prices for South African stocks are usually measured in ZAC, or South African cents. Sometimes the data provider gets this wrong and returns values in ZAR, or South African rand.
I then create charts with this data and the chart is distorted:
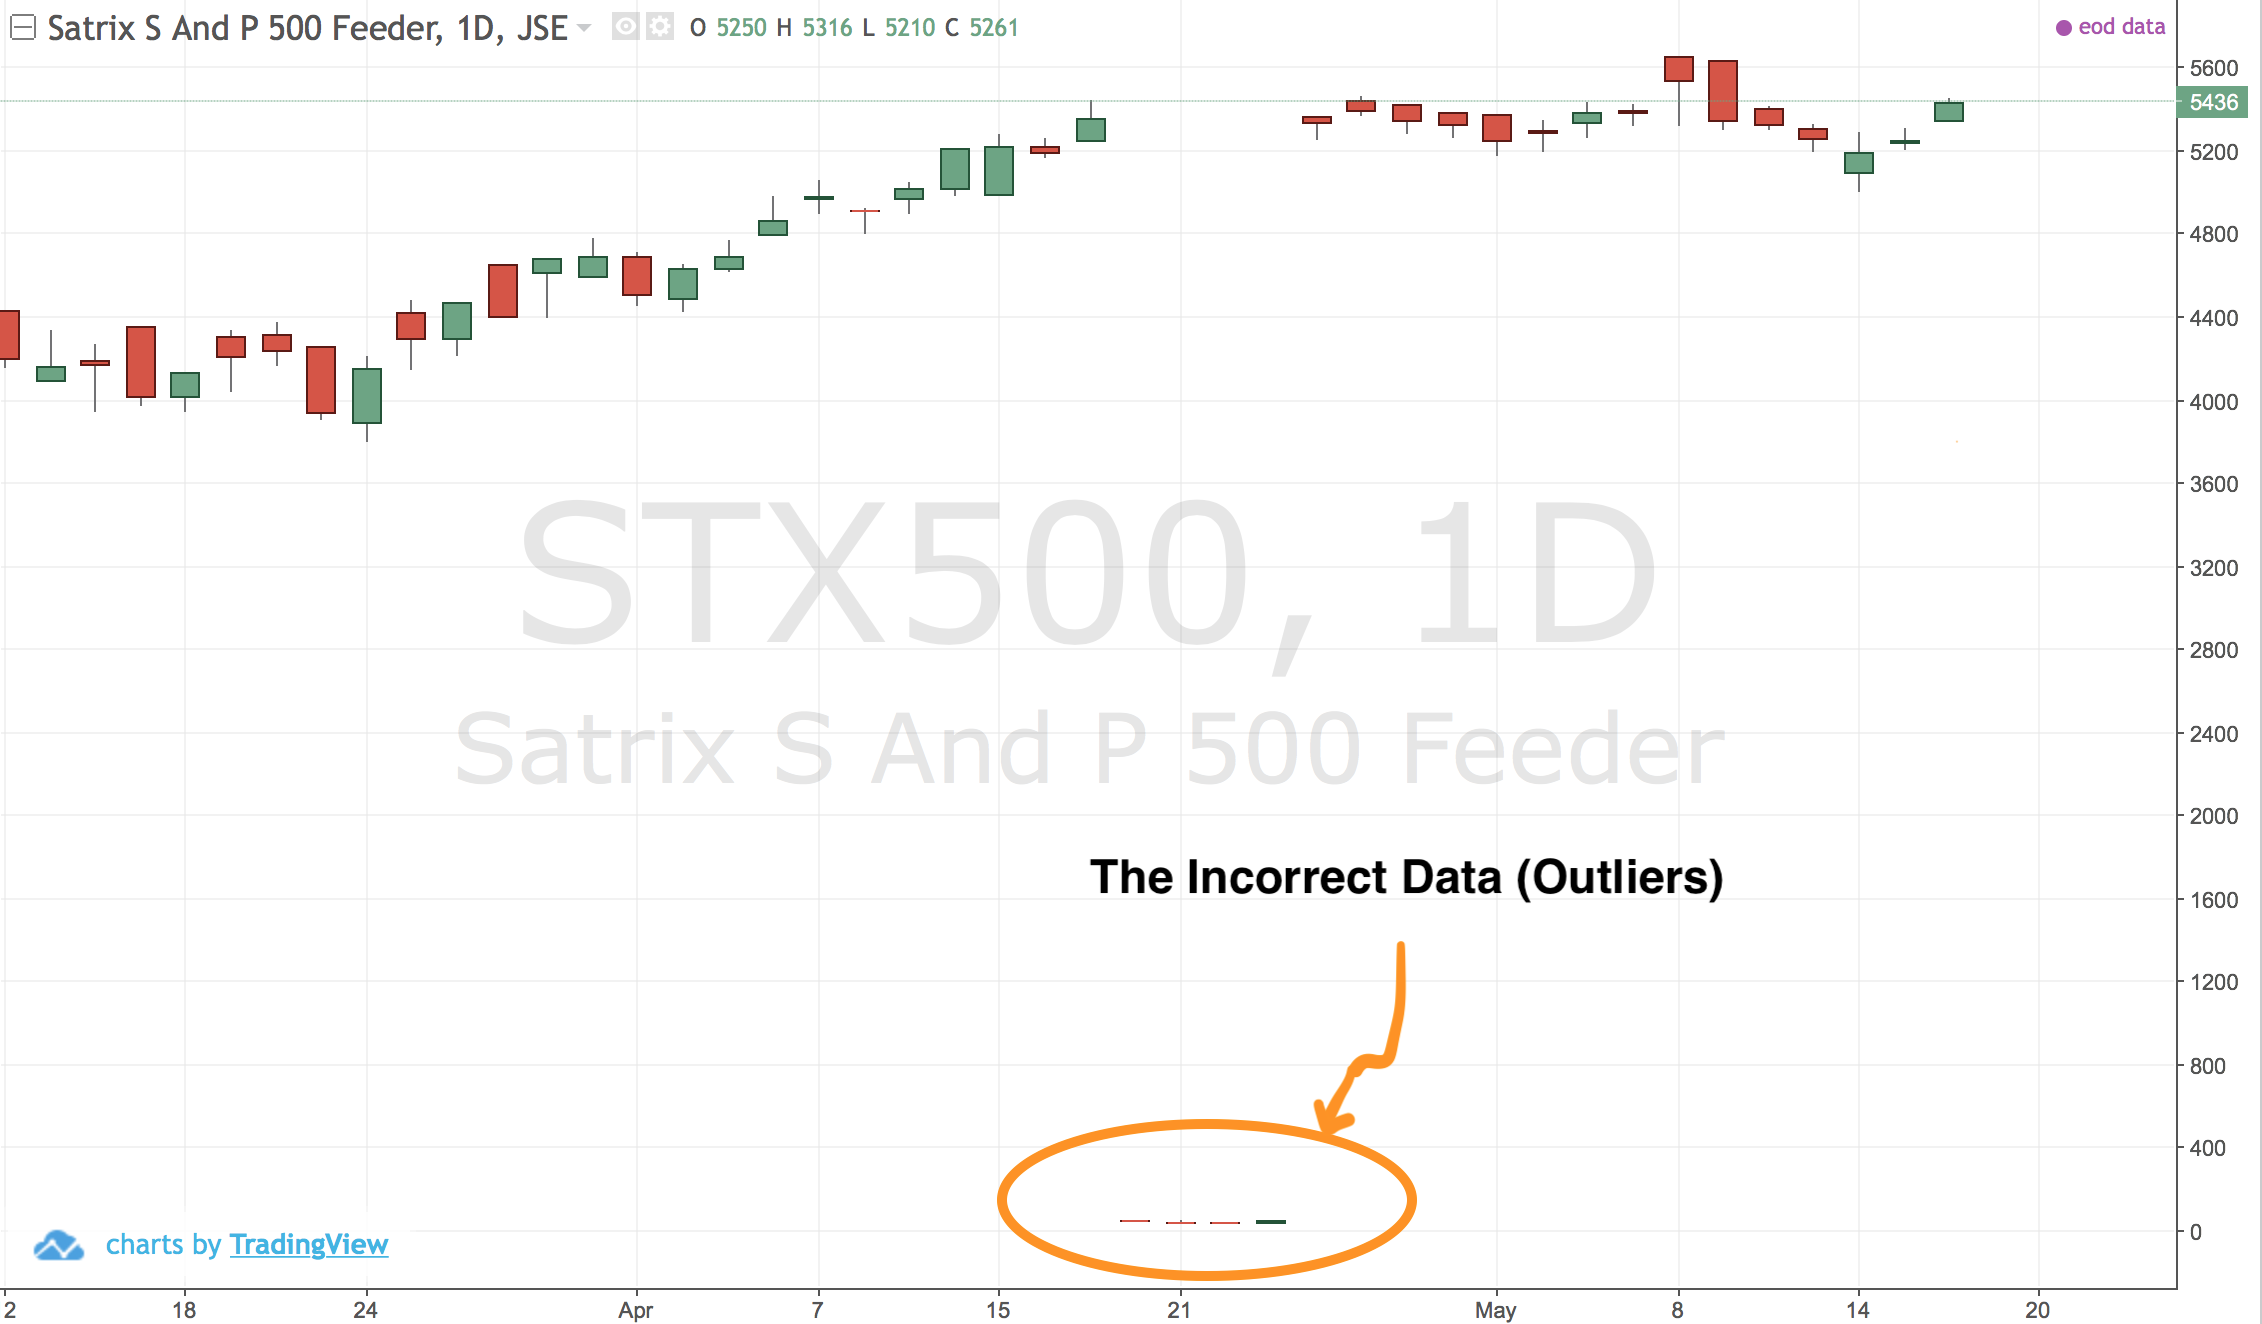
I wanted to fix this error across all stock tickers and started researching ways to detect outliers.
It turns out detecting outliers is a large topic with many possible methods.
Here is an example of the data:
        iddly    close          hgh           lw  ...      low  volume     high       date
634  19763448  5216.00  5219.000000  4985.000000  ...  4985.00   80613  5219.00 2020-04-14
635  19764373  5230.00  5281.000000  5000.000000  ...  5000.00   54536  5281.00 2020-04-15
636  19765306    52.14    52.650000    51.700000  ...    51.70   27823    52.65 2020-04-16
637  19766199    53.55    54.490000    52.560000  ...    52.56  111940    54.49 2020-04-17
638  19769872    53.47    54.580000    52.710000  ...    52.71   53734    54.58 2020-04-20
639  19769873    52.55    53.700000    52.210000  ...    52.21   41918    53.70 2020-04-21
640  19769874    52.46    53.080000    52.150000  ...    52.15   53420    53.08 2020-04-22
641  19769875    53.91    54.230000    52.600000  ...    52.60   18930    54.23 2020-04-23
642  19769876    53.46    53.750000    52.570000  ...    52.57   61954    53.75 2020-04-24
643  19772580    54.00    54.690000    53.720000  ...    53.72   98068    54.69 2020-04-28
644  19772581  5354.00  5425.000000  5281.000000  ...  5281.00   62498  5425.00 2020-04-29
645  19776752  5332.00  5390.000000  5269.000000  ...  5269.00   53918  5390.00 2020-04-30
646  19779540  5261.00  5385.000000  5181.000000  ...  5181.00  234668  5385.00 2020-05-04
647  19779541  5299.00  5349.000000  5199.000000  ...  5199.00   25726  5349.00 2020-05-05
648  19779542  5394.00  5435.000000  5265.000000  ...  5265.00   63998  5435.00 2020-05-06
649  19782351  5395.00  5427.000000  5326.000000  ...  5326.00   66404  5427.00 2020-05-07
650  19782352  5550.00  5657.000000  5325.000000  ...  5325.00   36062  5657.00 2020-05-08
651  19782353  5353.00  5640.000000  5300.000000  ...  5300.00  139934  5640.00 2020-05-11
Whenever this happens, the data points are divided by 100. So how can we detect this?
Methods#
The nature of the data means there are fluctuations in stock prices, sometimes very large ones like 90%.
Also over the history of a stock it may go from 10 to 9000, hence the quantiles won’t catch a recent price / 100.
You can also get the mean and standard deviation and use that to clip the edges of the bell. In that case you would need data that has a standard distribution. Ie. not stock data.
Nonetheless, the standard deviation method is often called the z-score.
z-score = (observation - mean) / standard deviation
I took the single column from the data and ran the z-score over it:
from scipy import stats
import numpy as np

y = df['close']
z_score = stats.zscore(y)

z = np.abs(z_score)
Summarised into a single call:
all_outliers = df[np.abs(stats.zscore(df['close'])) > 3]
It does find all our outliers:
ipdb> all_outliers
        iddly  close        hgh         lw     vlm  ...   open    low  volume   high       date
636  19765306  52.14  52.650000  51.700000   27823  ...  52.30  51.70   27823  52.65 2020-04-16
637  19766199  53.55  54.490000  52.560000  111940  ...  52.56  52.56  111940  54.49 2020-04-17
638  19769872  53.47  54.580000  52.710000   53734  ...  54.58  52.71   53734  54.58 2020-04-20
639  19769873  52.55  53.700000  52.210000   41918  ...  52.60  52.21   41918  53.70 2020-04-21
640  19769874  52.46  53.080000  52.150000   53420  ...  52.50  52.15   53420  53.08 2020-04-22
641  19769875  53.91  54.230000  52.600000   18930  ...  52.60  52.60   18930  54.23 2020-04-23
642  19769876  53.46  53.750000  52.570000   61954  ...  53.69  52.57   61954  53.75 2020-04-24
643  19772580  54.00  54.690000  53.720000   98068  ...  54.50  53.72   98068  54.69 2020-04-28
Unfortunately, this only worked in this case.
I then looked at this Stack Overflow answer, which looks for a change of 50% from the previous day and gets the range of that index:
bad_idx = df.index[df['close'].pct_change().abs().ge(0.5)]
outliers = df.loc[(df.index >= bad_idx.min()) & (df.index < bad_idx.max())]
This only works if there is one continuous instance of bad data.
Sources#
- Stack Overflow: Detect and exclude outliers in pandas DataFrame
- Stack Overflow: How to replace outlier data in pandas
- Towards Data Science: Ways to detect and remove outliers
- Medium: Finding outliers in dataset using Python
- Nextjournal: How to remove outliers in data with pandas
- MachineLearningMastery: How to Remove Outliers for Machine Learning